The (Chinese) new year of the Ox has begun, and the Chinese zodiac predicts positive events to take place.
To date we’ve seen the year of the Ox twice before – in 1997 when the Asian Financial Crisis unfolded, and in 2009 when the Global Financial Crisis hit. Despite these crises, the China onshore equities market (ie the ‘A-share’ market) performed strongly.
Will 2021’s year of the Ox see another solid performance from the China A-share market?
Performance spotlight
In 2020, China’s stock market generated strong returns. While the MSCI All Country World Index returned 14.8%, the MSCI China A Index returned 31.7% and the MSCI China All Shares Index 30.0%1.
Comparatively, the Australian stock market returned investors 1.4%.
China’s stocks were driven not only by an early economic recovery from the COVID-19 pandemic but also from economic restructuring, as China continues its transition to a more sustainable consumption and innovation-led services model.
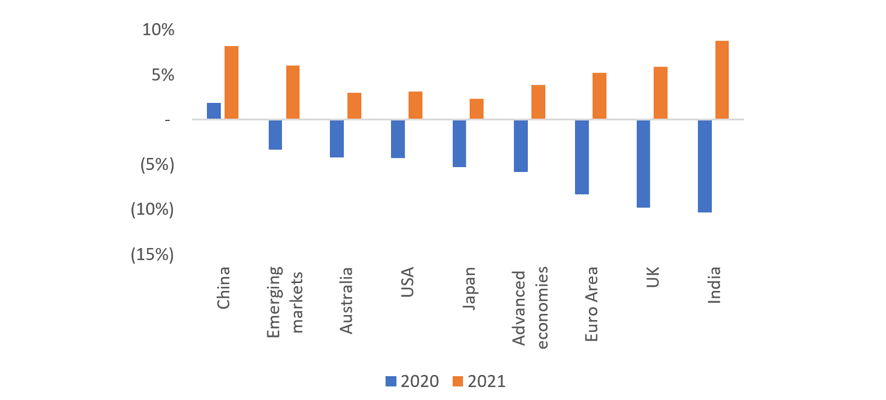
Real growth in GDP
With gross domestic product (GDP) growth of 1.9% in 2020, it’s anticipated China will deliver GDP growth of 8.2% in 2021, illustrating the strength of the economy.

Economic growth projections (real annual GDP growth in %)2
One of the largest equity markets in the world
One of the largest equity markets in the world, the China A-share market features over 3,700 companies with a combined market capitalisation of over A$10 trillion3.
Historically, due to policy restrictions, it has been difficult (and sometimes impossible) for foreign investors to access this market. The closest global investors could get was acquiring Chinese equities listed on the Hong Kong stock exchange (ie China ‘H-shares’).
China’s continued effort to open-up its financial markets and welcome foreign capital now means A-shares are increasingly accessible for foreign investors. These changes provide international investors the opportunity to access the growth potential of one of the world’s economic super-powers.
MSCI sees China’s potential
In response to China’s welcoming of foreign capital, FTSE Russell, the S&P Dow Jones and MSCI have all increased the weighting of China A-shares in their indices.
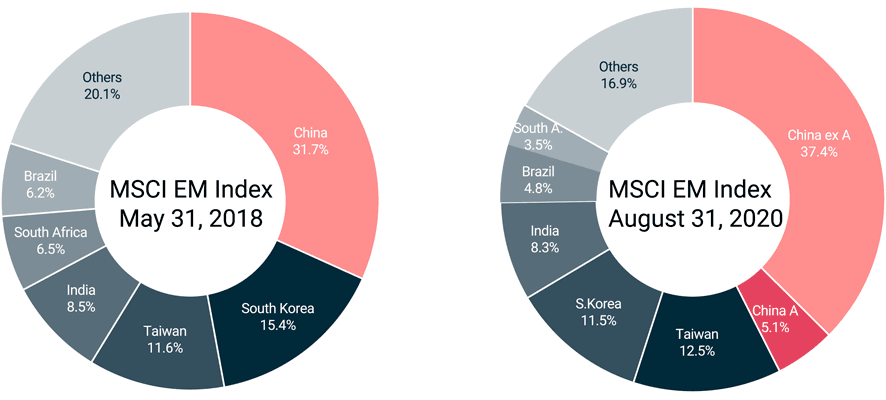
In February 2019 MSCI announced it would increase the inclusion ratio of China A-shares in the MSCI Emerging Markets Index to 20%, and include mid-cap China A-shares later that same year.
Following this increase, global investor interest in Chinese stocks increased significantly. The opening of special segregated accounts, a proxy for international investors’ readiness and appetite to trade A-shares, surpassed 10,600 accounts as of June 2020, up from less than 1,700 three years prior4.

Composition of the MSCI EM Index: May 2018 v August 2020
Alpha opportunities in China A-shares
Unlike developed capital markets, the China A-share market is still dominated by local retail investors who tend to have a short-term focus and trade frequently.
As a result, the China market tends to be very liquid but also volatile such that stock prices often deviate significantly from their underlying long-term fundamentals.
While nervous and inexperienced investors may be deterred by the volatile market, such pricing discrepancies create alpha-generation opportunities for experienced active managers familiar with the nuances of the region.
For example, the A-share portfolios managed by China Asset Management Co. (ChinaAMC), one of China’s top five asset managers, have consistently outperformed the indices with their top picks including:
- Kweichow Moutai Group, a high-end Chinese liquor company, achieved ~70% returns in 2020, and their share price has increased over nine times over the past five years
- Contemporary Amperex Technology, a leading electric vehicle battery company, saw a three-times increase in their share price in 2020 and a 9.5-times increase since listing in mid-2018.
The China A-share market is full of opportunity, and time will tell whether the zodiac’s prediction is correct and we’ll see a bull market in 2021's year of the Ox.
For more information about our equities capabilities and solutions, please get in touch.
1. Factset, representing total return in local currencies.
2. Source: IMF – World Economic Outlook Growth Projections.
3. Represents total listed A-share stocks on Shanghai Stock Exchange and Shenzhen Stock Exchange.
4. Source: MSCI https://www.msci.com/www/blog-posts/china-a-shares-what-have-we/02164045217.
Important Information: This material has been prepared by MA Investment Management Pty Ltd (ACN 621 552 896) (“MA Financial Group”), a Corporate Authorised Representative of MA Asset Management Ltd (ACN 142 008 535) (AFSL 327 515). The material is for general information purposes and must not be construed as investment advice. This material does not constitute an offer or inducement to engage in an investment activity nor does it form part of any offer or invitation to purchase, sell or subscribe for in interests in any type of investment product or service. This material does not take into account your investment objectives, financial situation or particular needs. You should read and consider any relevant offer documentation applicable to any investment product or service and consider obtaining professional investment advice tailored to your specific circumstances before making any investment decision. This material and the information contained within it may not be reproduced or disclosed, in whole or in part, without the prior written consent of MA Financial Group. Any trademarks, logos, and service marks contained herein may be the registered and unregistered trademarks of their respective owners.
Nothing contained herein should be construed as granting by implication, or otherwise, any licence or right to use any trademark displayed without the written permission of the owner. Statements contained in this material that are not historical facts are based on current expectations, estimates, projections, opinions and beliefs of MA Financial Group. Such statements involve known and unknown risks, uncertainties and other factors, and undue reliance should not be placed thereon. Additionally, this material may contain “forward-looking statements”. Actual events or results or the actual performance of a MA Financial Group financial product or service may differ materially from those reflected or contemplated in such forward-looking statements. Certain economic, market or company information contained herein has been obtained from published sources prepared by third parties. While such sources are believed to be reliable, neither MA Financial Group or any of its respective officers or employees assumes any responsibility for the accuracy or completeness of such information. No person, including MA Financial Group, has any responsibility to update any of the information provided in this material


