

China is undergoing a fundamental structural shift. It is moving away from an economy reliant upon low value manufacturing-based exports towards high value manufacturing-based exports and a domestic consumption and an innovation-led services model to support long-term sustainable growth. Rising incomes, urbanisation, and premiumisation has pushed consumption as the main driver of GDP, leading to the emergence of a range of new and innovative companies.
This evolution of China is creating a plethora of opportunities – particularly for astute equities investors seeking to diversify their portfolio and capitalise on the world’s second largest economy.
MSCI and FTSE well on their way to increasing China exposure
China now accounts for 18% of global GDP on a purchasing power parity (PPP) basis1 and has the world’s second largest stock market behind the US.2 It is anticipated China will become the world’s biggest economy by traditional metrics by around 20303.
Despite this, international investors’ allocation to China sits at around only 3.7% if represented by the commonly used MSCI AC World Index (ACWI).4 In comparison, index exposure to the US is at 60.8%.5 Firms like MSCI and FTSE are well on their way to increasing China exposure into their indices, looking to adopt a more true-to-form representation of the economy.
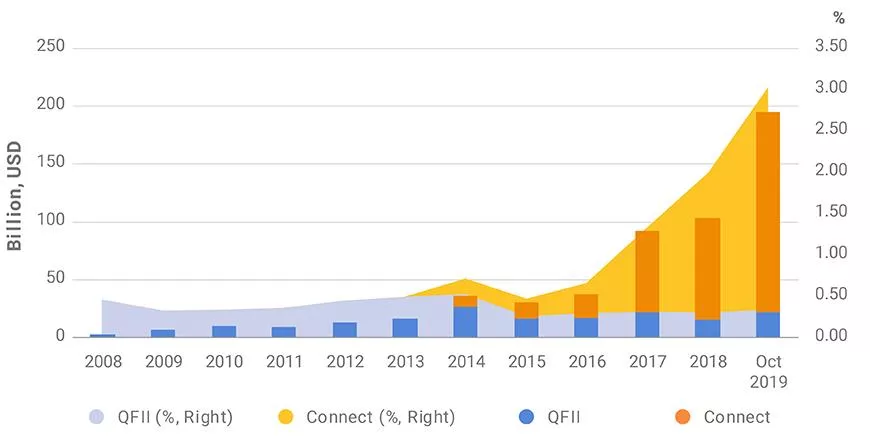
Since the inclusion of China A-shares in MSCI Indices, the market has experienced significant flows. Foreign holdings of China A-shares rose from US$38billion or 0.67% of the market in December 2016 to more than US$195 billion or 3.03% in September 2019.6 It is expected that rising representation of China in global indexes will boost foreign inflows by over US$1 trillion in the next five to 10 years.
Figure 17: Foreign investors’ holdings in China A shares in USD and as % of A shares’ total market cap
Sophisticated institutional investors are also taking a progressive approach to capture this increasingly important market. Singapore’s sovereign wealth fund, Temasek, currently has 27% exposure to China, making it the largest weighting in its portfolio.8 The Canada Pension Plan Investment Board (CPPIB) intends to double its exposure to China from 7.6% to up to 20% by 2025.9
China offers significant diversification benefits
To date, investors have typically gained exposure to China via offshore listings in Hong Kong (H-shares) or the US (ADRs) due to ease of access. However, onshore A-shares (listed in Shanghai or Shenzhen) have a major role to play in optimising a global portfolio, particularly as they offer greater diversification benefits.
The 10-year correlation between A-shares and the MSCI World Index sits at around 0.45, while offshore listed China stocks have a correlation of 0.6810.
Figure 211: Correlation of China A-shares and offshore stocks to global equities
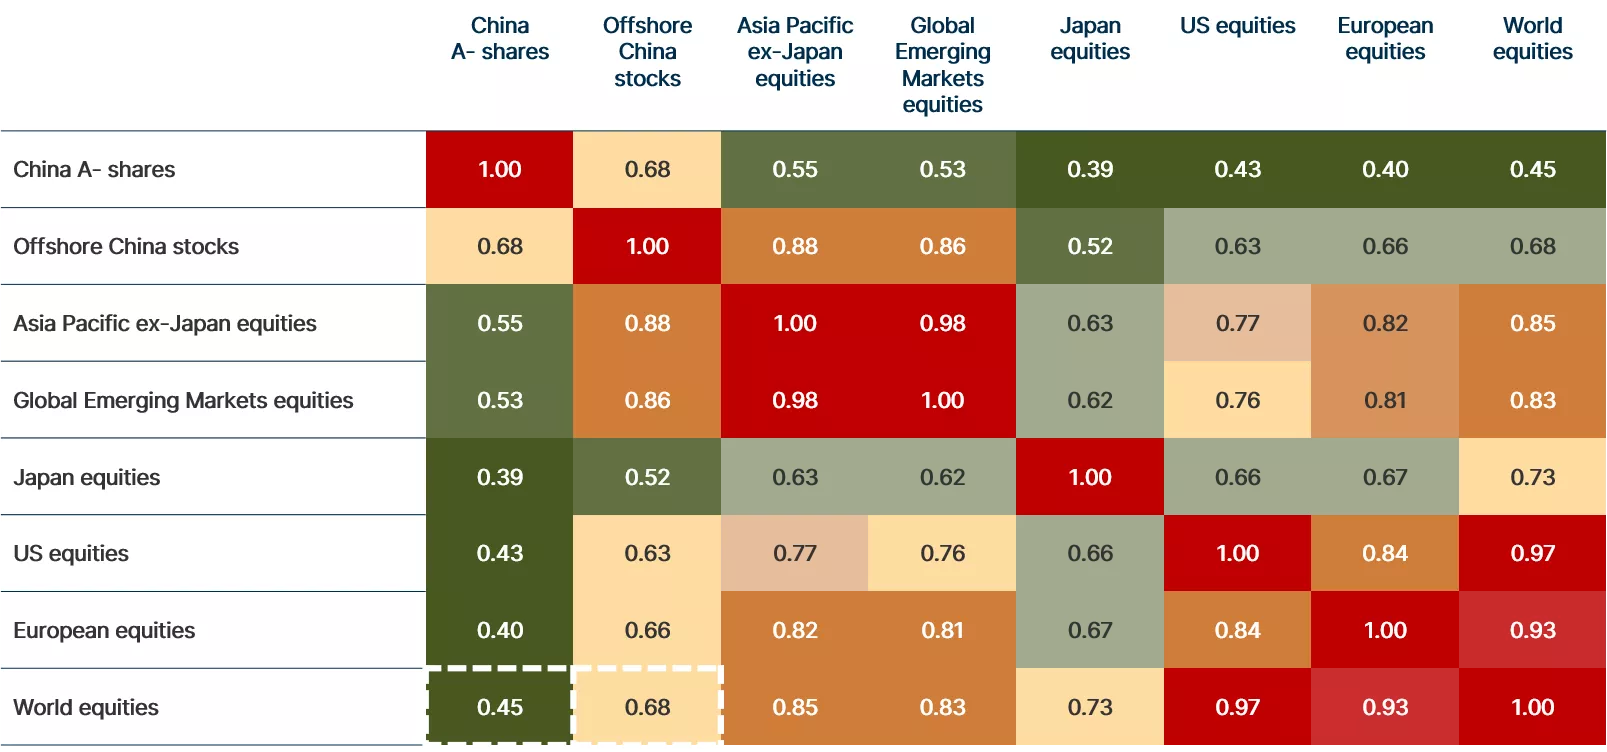
Distinct sector exposures between the two markets also present different opportunity sets and diversification benefits for investors. The offshore market in Hong Kong and the US has a much larger skew towards consumer discretionary and communication services, while the onshore A-share market offers greater exposure to China’s consumer staples and healthcare sectors. Emerging megatrends such as renewable technology and advanced manufacturing are also typically found in the onshore market in the likes of BYD Co. and Tianjin Zhonghuan Semiconductor.
Retail investors and mispricing creating outsized alpha opportunities
One of the biggest differences between the Chinese share market versus more mature markets is the composition of investors.
China’s A-share market is dominated by retail investors, who comprise 80% of trading volume. In contrast retail investors account for only 23% of all trades on the Hang Seng Index in Hong Kong12.
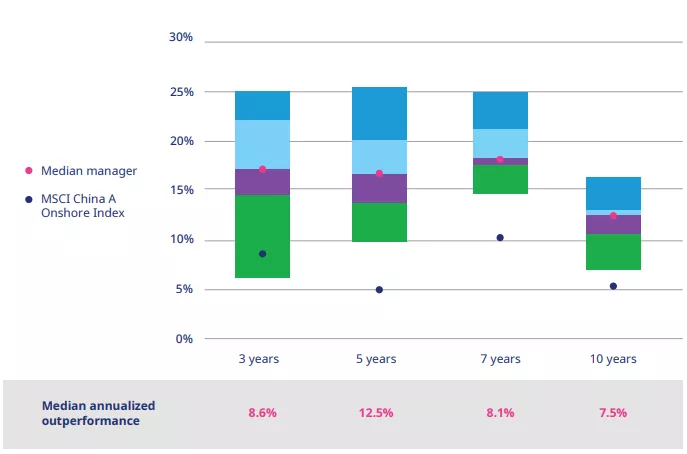
Retail investors in China tend to “have shorter time horizons, are more momentum driven, and less focused on corporate fundamentals.13” As a result, stocks are often mispriced creating opportunities for experienced active managers to capitalise on this inefficiency and generate outsized alpha opportunities. In fact, a recent study conducted by Mercer showed the median A-share manager has consistently outperformed the market over different time periods14.
Figure 315: The median A-share manager has consistently outperformed the market
Large, deep and liquid market
With over 3,70016 listed stocks, China’s equity market is the second largest in the world.
The average daily trading volume of an onshore stock is around US$13 million vs. US$8.5 million in the rest of the emerging market universe17, providing deep liquidity for investors.
The size of the equity market combined with its unique investor composition means low analyst coverage. 92% of the stock universe is covered by less than five analysts, while 61% or 1,965 companies are not covered by sell side analysts at all. In comparison, only 46% of US equities are covered by less than five sell side analysts and only 8% not covered at all18. With such a high magnitude of companies not covered by analysts, this information asymmetry creates further alpha opportunities for fundamental active managers.
Long gone are the days of viewing China as a low-cost manufacturing hub. It has emerged as the fastest growing and most diverse consumption story in the world, and its evolution is creating more obvious opportunities for astute equities investors with a long-term view ready to capitalise on the world’s second largest economy.
For more information about our investment solutions offering access to China A-shares, please get in touch.


1. IMF - World Economic Outlook database 2020 data. https://www.imf.org/en/Publications/SPROLLS/world-economic-outlook-databases.
2. Securities and Futures Commission. https://www.sfc.hk/-/media/EN/files/SOM/MarketStatistics/a01.pdf.
3. Centre for Economics and Business Research (CEBR), January 2022.
4. MSCI ACWI Index, as of end Jan 2022. https://www.msci.com/documents/10199/8d97d244-4685-4200-a24c-3e2942e3adeb
5. MSCI AC World, as of end Jan 2022.
6. MSCI: https://www.msci.com/www/blog-posts/emerging-markets-since-china-a/01662775315.
7. As above.
8. https://www.temasek.com.sg/en/what-we-do/our-portfolio#geography
9. https://www.ft.com/content/002dcf66-a22e-11e8-85da-eeb7a9ce36e4
10. Bfinance “Rethinking China’s Role in Emerging Market Equity Portfolios” Calculated based on monthly data for the ten years to 31st May 2020.
11. Bfinance, Bloomberg, calculated based on monthly data for the ten years to 31st May 2020. Indices: MSCI China A Onshore, MSCI China, MSCI AC Asia Pacific ex-Japan, MSCI EM, TOPIX, S&P 500, MSCI Europe, MSCI World.
12. Bfinance, Rethinking China’s Role in Emerging Market Equity Portfolios.
13. Willis Towers Watson, The Merits of a Standalone Equity Allocation to China, 2020.
14. Mercer - Positioning your portfolio for the future of emerging markets. The Case for a dedicated China equity allocation, May 2021.
15. MercerInsight. As at December 31, 2020 gross of fees.
16. Shanghai Stock Exchange and Shenzhen Stock Exchange
17. J.P. Morgan Emerging Markets Equity Research June 2020.
18. Factset, Jun 2019.
Important Information: This material has been prepared by MA Investment Management Pty Ltd (ACN 621 552 896) (“MAIM”), a Corporate Authorised Representative of MAAM RE Limited ACN 135 855 186 AFSL: 335783. The material is for general information purposes and must not be construed as investment advice. This material does not constitute an offer or inducement to engage in an investment activity nor does it form part of any offer or invitation to purchase, sell or subscribe for in interests in any type of investment product or service. This material does not take into account your investment objectives, financial situation or particular needs. You should read and consider any relevant offer documentation applicable to any investment product or service and consider obtaining professional investment advice tailored to your specific circumstances before making any investment decision. Any investment in a fund managed by an affiliate of MA Financial Group is subject to the terms and conditions of the relevant fund offer document. This material and the information contained within it may not be reproduced or disclosed, in whole or in part, without the prior written consent of MAIM. Any trademarks, logos, and service marks contained herein may be the registered and unregistered trademarks of their respective owners.
Nothing contained herein should be construed as granting by implication, or otherwise, any licence or right to use any trademark displayed without the written permission of the owner. Statements contained in this material that are not historical facts are based on current expectations, estimates, projections, opinions and beliefs of MAIM. Such statements involve known and unknown risks, uncertainties and other factors, and undue reliance should not be placed thereon. Additionally, this material may contain “forward-looking statements”. Actual events or results or the actual performance of MAIM or an MA Financial Group financial product or service may differ materially from those reflected or contemplated in such forward-looking statements. Certain economic, market or company information contained herein has been obtained from published sources prepared by third parties. While such sources are believed to be reliable, neither MAIM, MA Financial Group or any of its respective officers or employees assumes any responsibility for the accuracy or completeness of such information. No person, including MAIM and MA Financial Group, has any responsibility to update any of the information provided in this material.